
AI Channel Analytics Is Now Generally Available
WISLR AI Channel Analytics is live. It is a server-level reporting and attribution dashboard for the AI and LLM traffic that browser-based analytics tools measure poorly or miss entirely. It captures every request hitting your domain at the edge, classifies AI activity by verified bot fingerprint, and reports training crawls, conversation citations, real-user referrals, and AI-attributed sales in one live view across ChatGPT, Gemini, Claude, Perplexity, and every other LLM bot.
The first 30 days are free on every plan. After that, pricing starts at $200 per month for sites up to 1,000,000 monthly sessions, with no setup fee. Deployment happens the same day, and on most sites behind an edge CDN service the dashboard is live in minutes. The full product page is at AI Channel Analytics.
Why We Built It
We built this because the tools most teams rely on cannot see most of the AI channel, and the reasons are baked into how those tools work. Browser-based analytics tools, GA4 included, only log a request when a JavaScript tag fires in a real browser. Two of the most important AI behaviors never open a browser at all. Training crawlers read your pages server to server. Citation fetches happen when an AI assistant pulls a page mid-conversation to answer a live question, and the answer renders inside the chat. Neither one fires a tag, so a browser-based report never sees them.
The third behavior, a real user clicking through from an AI answer, is partially visible but badly undercounted. Our device-by-device testing across ChatGPT, Gemini, and Claude found that mobile AI apps render outbound links in isolated WebViews that strip the referrer, and Gemini and Claude pass no attribution signal on most platforms. The result is a 2.5x to 5x undercount of AI-referred sessions. The full methodology is in LLM Traffic Is a Blind Spot in Your Analytics.
The other tool category, AI-visibility and Share of Voice platforms, works from the opposite direction. Those tools query AI engines with a sample basket of prompts and report an estimated share of AI answers. That approach is useful for competitive benchmarking, but the number is an estimate built from prompts an analyst picked, and it never touches your site. A score tells you AI mentions your brand; it cannot tell you which pages AI reads, who it sends to your site, or what those visitors buy.
AI Channel Analytics fills the space between the two with verified, first-party measurement of what the AI channel actually does on your site, starting at the first crawl and following it all the way to revenue.
Four Signals, Not One Number
The dashboard is organized around the signal model we published in LLM Traffic Monitoring: The Three Signals, extended at launch with a fourth signal that closes the loop to revenue.
Each signal comes from a different AI behavior, hides from browser-based analytics in a different way, and calls for different work. Rolling them into one traffic number buries all of that, which is why the dashboard keeps them separate.
What Ships in the Dashboard
The launch dashboard includes five headline report views, each answering a question teams actually bring to the data.
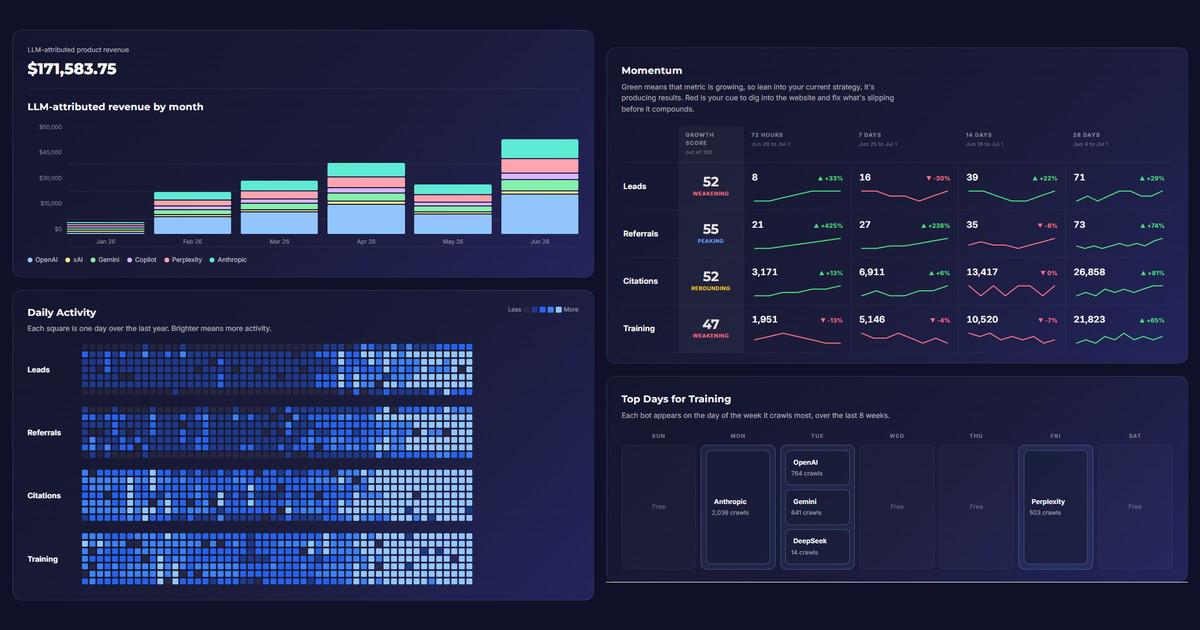
- Momentum. A growth score per signal over the trailing period, so you can see at a glance whether training, citations, referrals, and revenue are accelerating or stalling.
- Top Days for Training. The days AI training bots crawl you hardest, per engine, so publishing and update schedules can line up with when models are actually reading.
- LLM-Attributed Revenue. Revenue matched to AI sources, sliced by vendor: OpenAI, Gemini, Copilot, Perplexity, Anthropic, and xAI, each segment traceable to the orders behind it.
- Top Referral Destinations. The pages where AI chat referrals land most over the last 30 days, with training, citation, and referral counts per page.
- Daily Activity. A year-long heatmap of leads, referrals, citations, and training crawls, one square per day, showing how AI-channel activity trends over time.
Behind the headline views sit the working reports: AI bot crawl coverage by engine and page, a fetched-content leaderboard, conversion funnels by AI source, revenue attribution with time-to-purchase by platform, product and buyer-level detail, content freshness for AI training, and pages crawled but never cited. Each view is designed to leave you with something to do next, not just a number to watch.
How the Data Is Captured
The numbers come from three mechanisms, all of them running at the server level.
- Server-level request logging. Every HTTP request hitting your domain is captured at the edge, including requests from AI bots that never execute JavaScript. There is no tag to fire and no dependence on cookie consent.
- AI bot fingerprinting. User-agent matching plus verified IP range checks classify every bot by platform with high confidence, separating GPTBot from ChatGPT-User from an impersonator.
- Order and lead attribution. AI-referred visits are matched to order confirmations and form fills for verified revenue attribution, with probabilistic matching covering the rest.
Deployment depends on how your site is served. Sites running their own edge CDN service activate directly, usually within minutes. Sites on platform-managed edges, Shopify, Wix, Squarespace, and BigCommerce, can be enabled with an added edge service. The site tester on the product page checks your domain and tells you which path applies before you commit to anything.
Use Cases
The same four signals read differently depending on what your site sells. These are the patterns we built the launch dashboard around.
Ecommerce: prove the AI channel pays, then feed it
Publishers and content teams: see what AI is reading and quoting
B2B and service businesses: attribute the leads AI sends
Agencies: report a channel your clients cannot see anywhere else
Site migrations and replatforms: protect AI coverage through the change
Content freshness: keep what AI has on file accurate
Pricing
The first 30 days are free on every plan. After that, a single flat monthly subscription scales with monthly session volume. Every plan includes the live dashboard and edge data capture, and there is no setup fee.
| Monthly sessions | Price per month |
|---|---|
| Up to 1,000,000 | $200 |
| Up to 3,000,000 | $250 |
| Up to 6,000,000 | $550 |
| Up to 10,000,000 | $750 |
For teams that want a partner to act on what the dashboard surfaces, a separate Senior Strategist engagement is available as a quarterly retainer starting at $6,250. The dashboard stands on its own; the strategist engagement is for teams that also want help interpreting the data and shipping the changes it points to.
How It Fits Next to the Tools You Already Have
AI Channel Analytics does not replace your analytics stack, and it is not another Share of Voice score.
Keep GA4, or whichever browser-based tool you run, for the channels it was built to measure. AI Channel Analytics covers the channel where the browser-based model structurally breaks: it sees the crawls and citation fetches that never open a browser, and it recovers the referral and revenue volume that WebViews and stripped referrers hide.
Keep a Share of Voice tool if off-site competitive benchmarking matters to you. It answers a different question: how often AI mentions your brand across a sampled set of prompts. AI Channel Analytics answers what happened on your site, with a verified request log rather than an estimate. The two work fine side by side, but only one of them can put a dollar figure on the channel. The KPI framework behind the dashboard is laid out in AI Performance Metrics: The Seven KPIs and the measurement model in LLM Traffic Monitoring: The Three Signals.
Getting Started
Setup happens the same day, and the free 30 days start as soon as data starts flowing.
- Test your site. The tester on the product page checks whether your domain runs on its own edge CDN service (direct activation) or a platform-managed edge like Shopify, Wix, Squarespace, or BigCommerce (enabled with an added edge service).
- Schedule setup. A short call covers deployment and confirms what the dashboard will track for your site.
- Watch the first signals land. Training crawls usually appear within hours; citations, referrals, and attributed revenue fill in as the log builds.