
Why the AI Channel Needs Its Own Report
Paid, organic, social and email each get their own report, with their own metrics, because each behaves differently. AI discovery is the newest of them and the least understood, and it is still mostly reported as a footnote inside a channel it does not belong to.
The reason it needs its own report is not novelty. It is that the mechanism is different. There is no ranking position, no impression count, no results page. A model reads your pages on a schedule, decides mid-conversation whether to reach for one of them, and occasionally sends a person to you with a link. Those are three separate events, produced by three separate behaviors, and a number from one of them predicts very little about the next.
So the useful question is not "how visible are we in AI." It is which stage of the channel is failing, because the fix for each one is different.
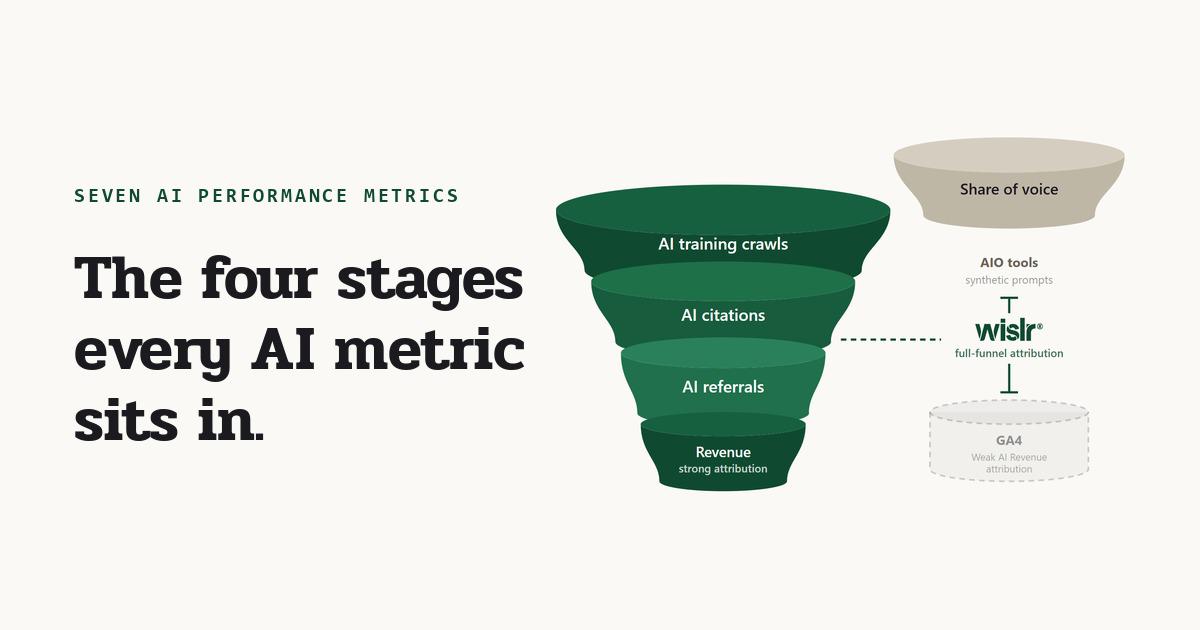
The Four Stages Every Metric Sits In
Before the metrics, the shape. Everything below answers a question about one of four stages, and they run in order. A page cannot be a citation candidate if it was never read, and it cannot send you a referral if it is never cited.
The Seven Metrics
Each of these is a panel in the WISLR AI Channel Analytics dashboard, read off first-party server logs. They are listed in funnel order, and the diagnostic value is in reading them against each other rather than one at a time.
Training coverage
Training- What it measures
- The share of your commercially important pages that AI training crawlers have actually read, not the raw number of crawl hits.
- How WISLR reports it
- Learned pages and training coverage, with daily crawl volume, your top training days, and a breakdown by engine.
- What good looks like
- Coverage concentrated on category, product and comparison pages. Broad coverage of a blog while the commercial catalog sits unread is a common and expensive pattern.
- Where it breaks
- Blocks in robots.txt, content that only exists after JavaScript runs, and slow responses that cause crawlers to give up.
Candidate coverage
Candidates- What it measures
- The share of pages fetched during live conversations. These are the pages a model considered good enough to pull while answering a real question, which makes this the closest thing to a vote of confidence the channel produces.
- How WISLR reports it
- Candidates and candidate coverage, with the individual candidate pages listed by title so you can see which content is being reached for.
- What good looks like
- Your money pages appearing as candidates, not just the homepage and one popular guide.
- Where it breaks
- Pages with no self-contained claim to quote. A model fetching your page still has to find a sentence it can stand behind.
Referral coverage
Referrals- What it measures
- The share of pages that earned an actual click out of an AI answer, and where those people landed.
- How WISLR reports it
- Referrals and referral coverage, with landing pages ranked, and referral volume tracked against training and candidate activity on the same timeline.
- What good looks like
- Referrals concentrated on pages that convert, rather than on informational content that answers the question so completely nobody needs to click.
- Where it breaks
- Mobile in-app browsers strip the referrer, so the visit lands in direct or other. This is the single largest source of undercounting in browser-based tools.
Growth score
All stages- What it measures
- Direction and speed rather than level. A single composite read on whether the channel is accelerating, holding, or decaying.
- How WISLR reports it
- A growth score with a momentum label, alongside a daily activity view so you can see whether a change is a trend or one unusual day.
- What good looks like
- Momentum that holds after a content push instead of spiking and returning to baseline within two weeks.
- Where it breaks
- Reading it daily. Crawl behavior is bursty by nature, and a single day is noise.
Engine mix
All stages- What it measures
- How your visibility distributes across OpenAI, Anthropic, Gemini and Perplexity, at each stage separately.
- How WISLR reports it
- A breakdown by LLM applied to training, candidates and referrals, so the mix can differ by stage and you can see it.
- What good looks like
- Presence across several engines. Concentration in one is a dependency, and engines change their crawling and citation behavior without notice.
- Where it breaks
- Assuming one engine's behavior generalizes. They differ in what they crawl, how often they fetch, and whether they link out at all.
Crawled but not cited
Training to candidates- What it measures
- Pages a model has read and never fetched into an answer. The gap between what it has and what it uses.
- How WISLR reports it
- A standing list of pages crawled but not cited, so the gap is a work queue rather than an inference.
- What good looks like
- A short and shrinking list on commercial pages. On thin or duplicative content, a long list is the correct outcome.
- Where it breaks
- Treating a crawl as the win. A crawl means the door was open, nothing more.
AI-attributed revenue
Revenue- What it measures
- Orders and leads traced back to the AI session that produced them, in currency.
- How WISLR reports it
- IP-to-order attribution with revenue over time, buyer-level detail, and time-to-purchase, split by engine where the data supports it.
- What good looks like
- Revenue per AI session that stands comparison with your other channels, and a time-to-purchase curve you can plan retargeting around.
- Where it breaks
- Session continuity. Someone who arrives from an AI answer and returns three days later to buy is invisible to a naive last-click model, which is why time-to-purchase belongs next to the revenue number.
Reading Them Against Each Other
Individually these are just numbers. The diagnostic value is in the steps between them, because each drop has one likely explanation and a different fix.
All seven are panels in WISLR.ai. It captures training crawls, mid-conversation fetches and AI referrals at the edge on your own domain, matches sessions back to orders, and reports coverage at every stage broken out by engine. No log pipeline to stand up, and the free plan keeps 30 continuous days of history so the baseline starts today.
How This Maps to Your SEO Report
These metrics sit alongside your SEO report, not on top of it. They come from different sources and answer different questions, and the closest analogue is often not an exact one.
Where to Start
Start at the top of the funnel, because a problem at stage one makes every number under it meaningless. Training coverage and crawled but not cited are enough to make the first round of decisions, and both come from the same log data.
The one thing worth doing immediately is starting the clock. Every metric here is a trend, and a trend needs a baseline. A brand that begins recording now has months of history when a competitor is still deciding what to measure, and history is the part you cannot backfill.
See these seven numbers on your own data.
WISLR AI Channel Analytics reports all seven from your own first-party server logs: training and candidate coverage by engine, the crawled-but-not-cited queue, growth score, and revenue matched back to the session. The free plan keeps 30 continuous days of history, which is enough to establish the baseline.